Emissions
This notebook demonstrates gcmprocpy’s emission calculation functions for NO 5.3 micron, CO2 15 micron, and OH v(8,3) band emissions.
Note: This notebook requires TIE-GCM or WACCM-X model output files.
[15]:
import warnings
warnings.filterwarnings('ignore')

%matplotlib inline
import numpy as np
import matplotlib.pyplot as plt
import gcmprocpy as gy
from gcmprocpy.data_emissions import mkeno53, mkeco215, mkeoh83
from gcmprocpy.data_emissions import arr_mkeno53, arr_mkeco215, arr_mkeoh83

directory = '/glade/work/nikhilr/tiegcm3.0/benchmarks/2.5/seasons/decsol_smin/hist'
datasets = gy.load_datasets(directory, dataset_filter='sech')
times = gy.time_list(datasets)
t_val = times[0]
print(f'Using time: {t_val}')
Using time: 2002-12-21T01:00:00.000000000
Direct Calculation: mkeno53
Compute 5.3 micron NO emission from raw arrays of temperature, atomic oxygen, and NO concentrations.
[16]:
arr_temp = np.array([500.0, 1000.0, 1500.0])
arr_o = np.array([1e10, 1e11, 1e12])
arr_no = np.array([1e7, 1e8, 1e9])

emission = mkeno53(arr_temp, arr_o, arr_no)
print(f'mkeno53: {emission}')
mkeno53: [8.02565741e-10 8.01849067e-07 4.51979015e-05]
Direct Calculation: mkeco215
Compute 15 micron CO2 emission from temperature, atomic oxygen, and CO2 concentrations.
[ ]:
arr_co2 = np.array([1e12, 1e13, 1e14])

emission = mkeco215(arr_temp, arr_o, arr_co2)
print(f'mkeco215: {emission}')
Direct Calculation: mkeoh83
Compute OH emission for the v(8,3) band from temperature, atomic oxygen, molecular oxygen, and molecular nitrogen.
[17]:
arr_o2 = np.array([1e12, 1e13, 1e14])
arr_n2 = np.array([1e14, 1e15, 1e16])

emission = mkeoh83(arr_temp, arr_o, arr_o2, arr_n2)
print(f'mkeoh83: {emission}')
mkeoh83: [1.56675219e-01 1.55476812e+01 1.09547106e+03]
From Datasets: arr_mkeno53
Compute 5.3 micron NO emission directly from loaded datasets at a specific time and level. Returns a PlotData object when plot_mode=True.
[18]:
result = arr_mkeno53(datasets, 'NO', t_val, selected_lev_ilev=5.0, plot_mode=True)
print(f'shape: {result.values.shape}')
print(f'unit:  {result.variable_unit}')
print(f'name:  {result.variable_long_name}')
shape: (72, 144)
unit:  photons cm-3 sec-1
name:  5.3-micron NO
From Datasets: arr_mkeco215
[ ]:
result = arr_mkeco215(datasets, 'CO2', t_val, selected_lev_ilev=5.0, plot_mode=True)
print(f'shape: {result.values.shape}')
print(f'unit:  {result.variable_unit}')
print(f'name:  {result.variable_long_name}')
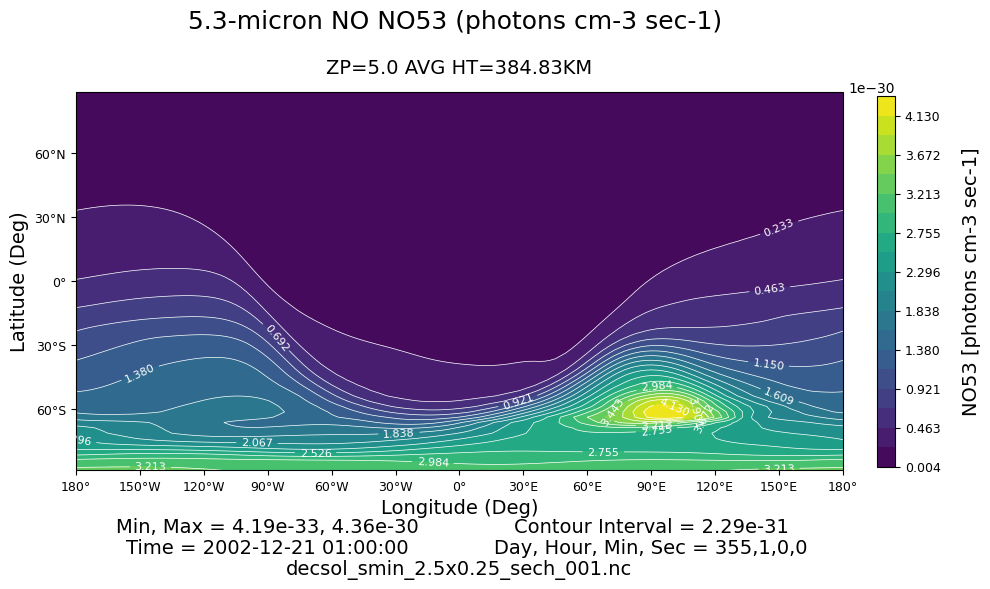
Plotting Emissions
Emission variable names (NO53, CO215, OH83) can be passed directly to plt_lat_lon for contour plots.
[19]:
fig = gy.plt_lat_lon(datasets, 'NO53', time=t_val, level=5.0)
plt.show()
[ ]:
fig = gy.plt_lat_lon(datasets, 'CO215', time=t_val, level=5.0)
plt.show()
Cleanup
[20]:
gy.close_datasets(datasets)
print('Datasets closed.')
Datasets closed.